Every solar project developer knows the moment: you're standing in front of a planning board, a landowner, or an investor, and they ask "What will this actually look like on the site? What about the shadows?" You pull up a static AutoCAD layout. Maybe a pre-rendered drone flyover that cost $5,000 and took three weeks. Their eyes glaze over. The approval gets deferred.
This demo is the tool that replaces that moment. It wraps a fully interactive 3D solar farm site model inside a convincing project portal (Meridian Solar Partners, Pinecrest Valley, 42 MW DC) so the viewer immediately understands what it is and how it fits into the solar development workflow. The stakeholder doesn't look at a picture — they explore the project themselves.
The planning board doesn't need to trust your PDF. They need to see the shadows move with their own hands.
What the stakeholder actually controls
Three sliders drive the entire experience. Each one addresses a specific question that stalls project approvals in the solar development process:
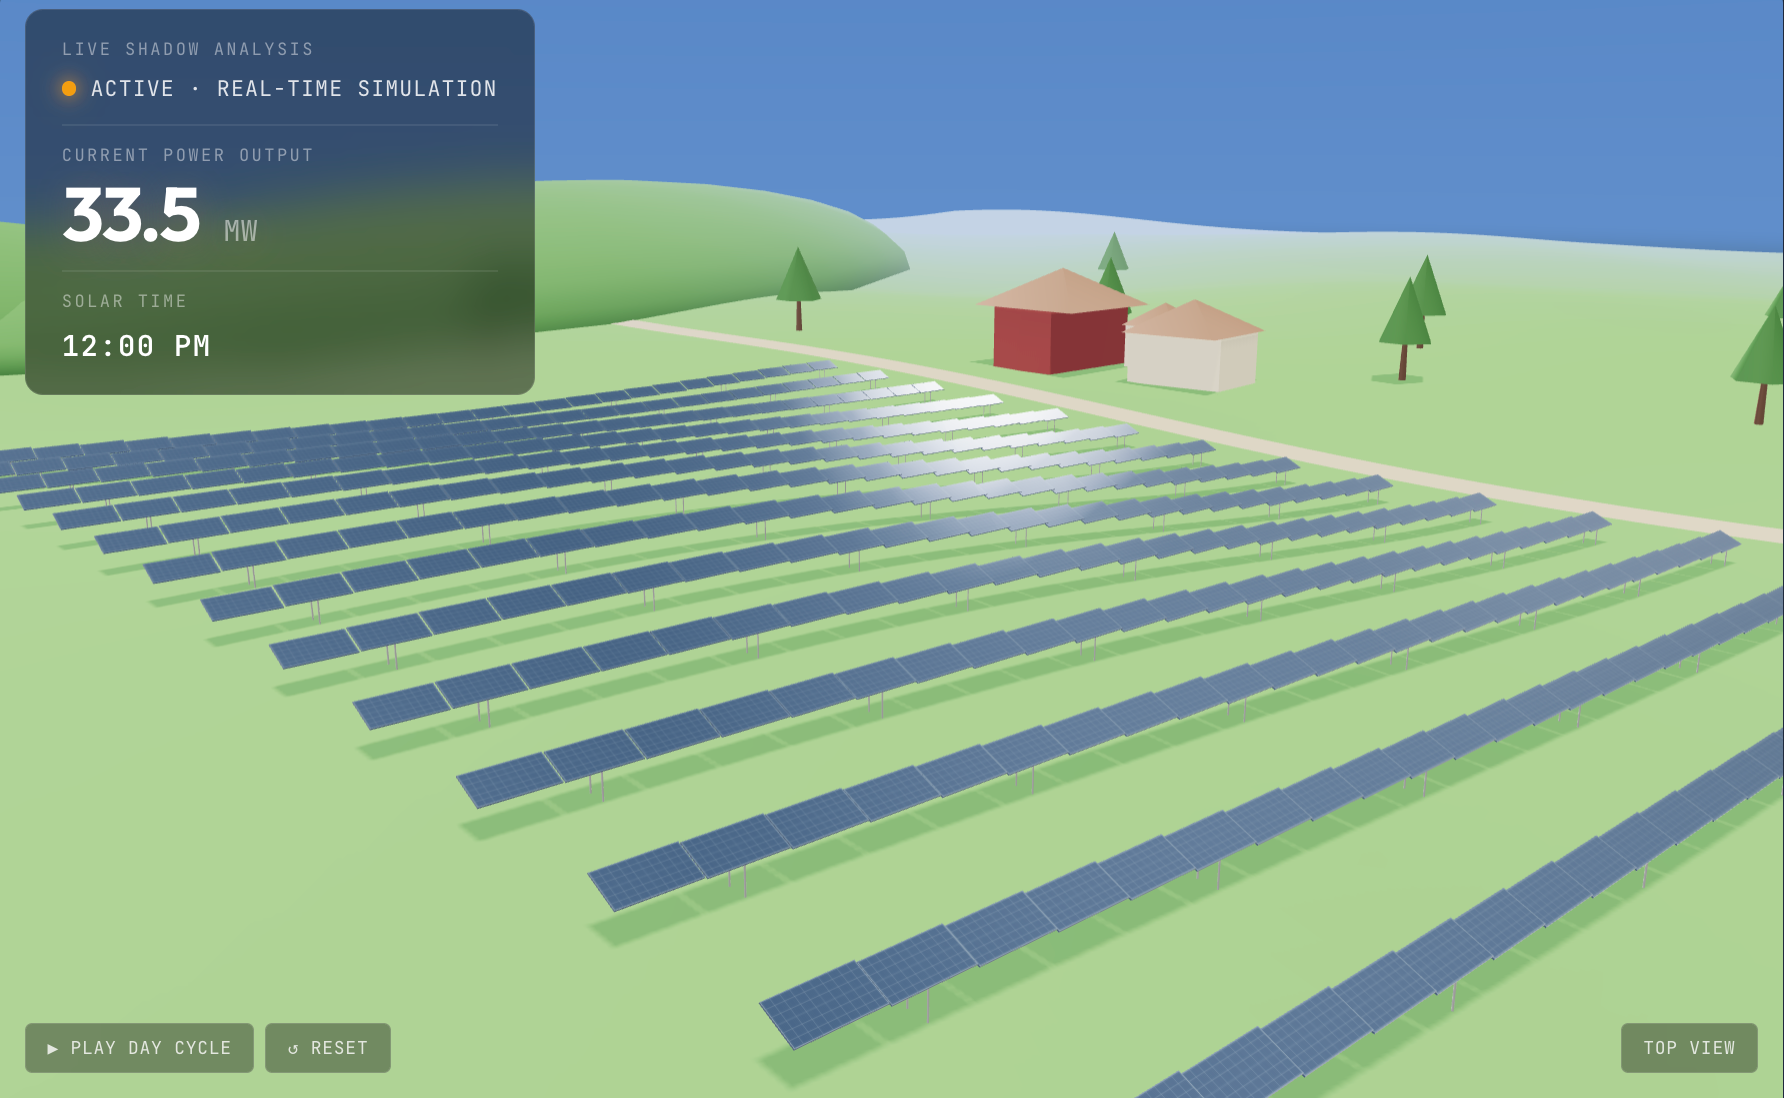
- Time of day (5:30 AM – 7:30 PM) — the sun arcs across a procedural sky dome with atmospheric scattering, casting real-time shadows from every panel row onto the terrain below. A planning board member can check 7 AM shadows on the neighboring property themselves, instead of taking your word for it.
- Panel tilt angle (5° – 45°) — panels physically rotate, shadow lengths change, and the energy yield recalculates. An investor can see the trade-off between steep tilt (better winter production, more shading) and low tilt (less shading, simpler mounting) in real time.
- Row spacing (3.5m – 10m) — all panel rows reposition live. Tighter spacing means more capacity per acre but more inter-row shading loss. The yield projections update instantly so the landowner sees the density trade-off without needing an engineering degree.
Live performance metrics that build confidence
Every time a slider moves, five numbers update alongside the 3D scene. These are the metrics that appear in every solar site assessment report — showing them live, responsive to configuration changes, collapses weeks of back-and-forth into 90 seconds of self-guided exploration:
- Current power output (MW) — real-time generation based on sun position, panel angle, and shading
- Daily and annual energy yield (MWh / GWh) — integrated across the full solar day with seasonal derating
- Capacity factor (%) — the metric every investor and lender evaluates first
- Ground coverage ratio — panel footprint vs. total site area, the key land-use metric for permitting
- Inter-row shading loss (%) — the number that drives every row-spacing decision
An investor who can drag a slider and watch the capacity factor change doesn't need a follow-up call to understand the project economics.
The scene tells the story
The 3D environment isn't an abstract tech demo — it's a recognizable rural landscape. Rolling terrain with gentle hills. A dirt access road. A farmstead with a barn and two houses. Perimeter trees. Background hill silhouettes fading into atmospheric fog. When the time slider hits 6:30 AM, the sky glows amber, the sun sits low on the horizon, long shadows stretch across the pasture, and the farmstead catches the first light. At noon, the scene is bright and shadows are compact. At 6:30 PM, the whole landscape warms to golden hour.
This environmental context is what separates a site assessment visualization from a product configurator. A planning board member looks at this and sees their county. A landowner sees their field. The project stops being abstract and starts being real.
Where this fits in the solar development workflow
- Planning board and zoning hearings
- Landowner lease negotiations
- Investor and lender due diligence presentations
- Community engagement meetings
- EPC bid proposals and design reviews
- Interconnection application support
- Environmental impact visual assessments
- Internal portfolio review dashboards
- Corporate PPA buyer presentations
- Public comment response materials
Performance and deployment
- 100% procedural — zero external 3D assets. Every tree, building, hill, panel row, and terrain vertex is generated in code. The entire demo is a single HTML file under 45 KB.
- Loads in under 2 seconds on 4G mobile. No model downloads, no texture fetches. The scene builds instantly on page load.
- 60 fps on mid-range laptops. InstancedMesh for panels, PCFSoftShadowMap for shadows, optimized draw calls.
- Deploys as a single file drop-in. Works inside any CMS, static site, or project management portal. No build step, no dependencies beyond the Three.js CDN.
- No subscription, no vendor lock-in. You own the code. Modify it, extend it, brand it, deploy it to every project in your pipeline.
How a custom build works for your projects
This demo uses a fictional site at 35.5°N latitude with representative terrain and layout parameters. A custom build for your company integrates your actual project data: real site coordinates (the sun-path math adjusts to any latitude), your panel specifications (wattage, dimensions, efficiency), your mounting system (fixed-tilt, single-axis tracker, or both), your terrain data (imported contours or LiDAR-derived elevation), and your brand identity wrapping the entire experience.
The result isn't a portfolio piece — it's a stakeholder engagement tool that deploys across your entire project pipeline. Build once, configure per site, deploy to every planning hearing, investor meeting, and community session.